UNLOCK TRAINING AND REHAB POTENTIAL WITH PRECISE, REP-BY-REP DATA

SEE IT IN ACTION: A400 TECHNOLOGY

Discover how easy it is to see the data from power, velocity, and range of motion that drives training and rehabilitation.

A400 TECHNOLOGY

NEXT-GEN TECHNOLOGY GROUNDBREAKING PERFORMANCE INSIGHTS.

A400 technology offers visual feedback and performance insights in real time.

And you can export A400 data for use in your analytics or records platform, whether it’s custom or off-the-shelf.

  • Power

    Power

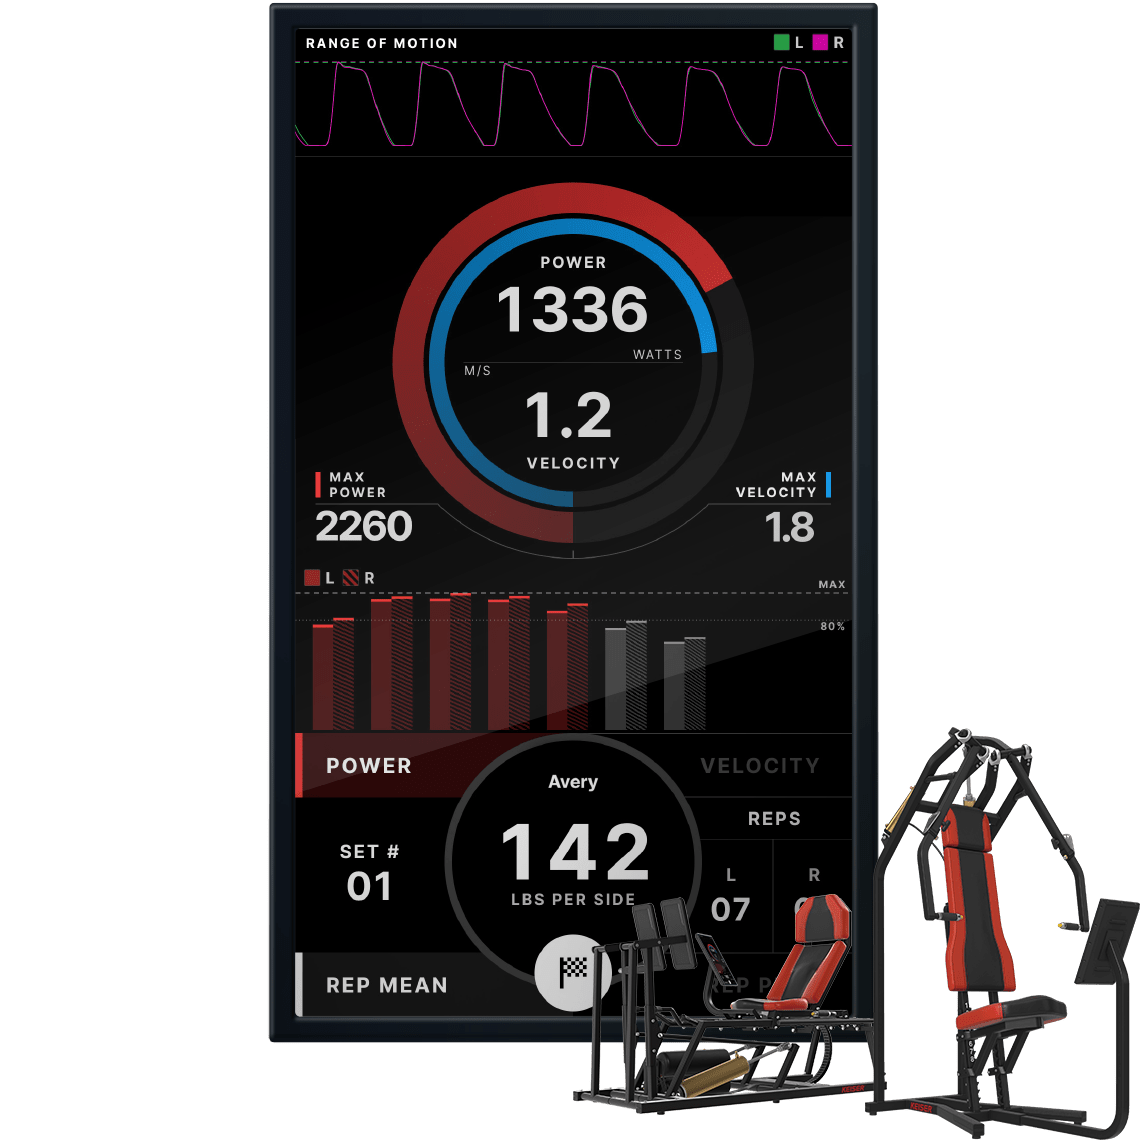
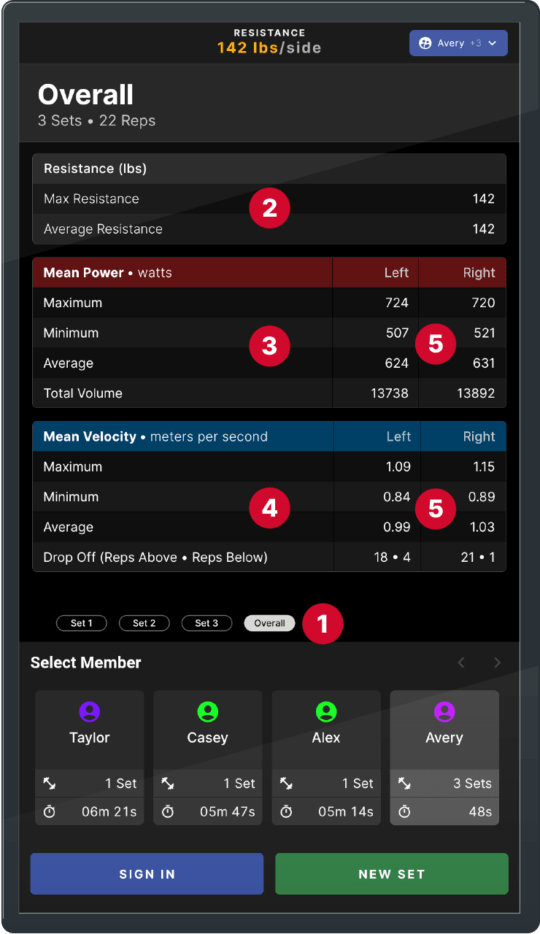
    See mean and peak power for each rep.

  • Velocity

    Velocity

    See mean and peak velocity for each rep.

  • Range of Motion

    Range of Motion

    See data for both concentric and eccentric phases for each rep.

  • Unilateral Comparison

    Unilateral Comparison

    See velocity and power data for left and right side by side on unilateral machines.

  • Custom Performance Drop-off

    Custom Performance Drop-off

    Know when reps become less effective. Optimize training time and reduce risk of injury.

MAKE ADJUSTMENTS FASTER. REAL-TIME DATA UNLOCKS PROGRESS.

  • Every workout can be a test.

    Every workout can be a test.

    Get testing data from every workout. Make program changes in real time to optimise workout time and continue to progress.

  • Maximise performance with real-time, visual feedback.

    Maximise performance with real-time, visual feedback.

    Research indicates real-time visual feedback can increase athlete intent. A400 technology provides the feedback that inspires improved performance.

  • Quantify progress automatically.

    Quantify progress automatically.

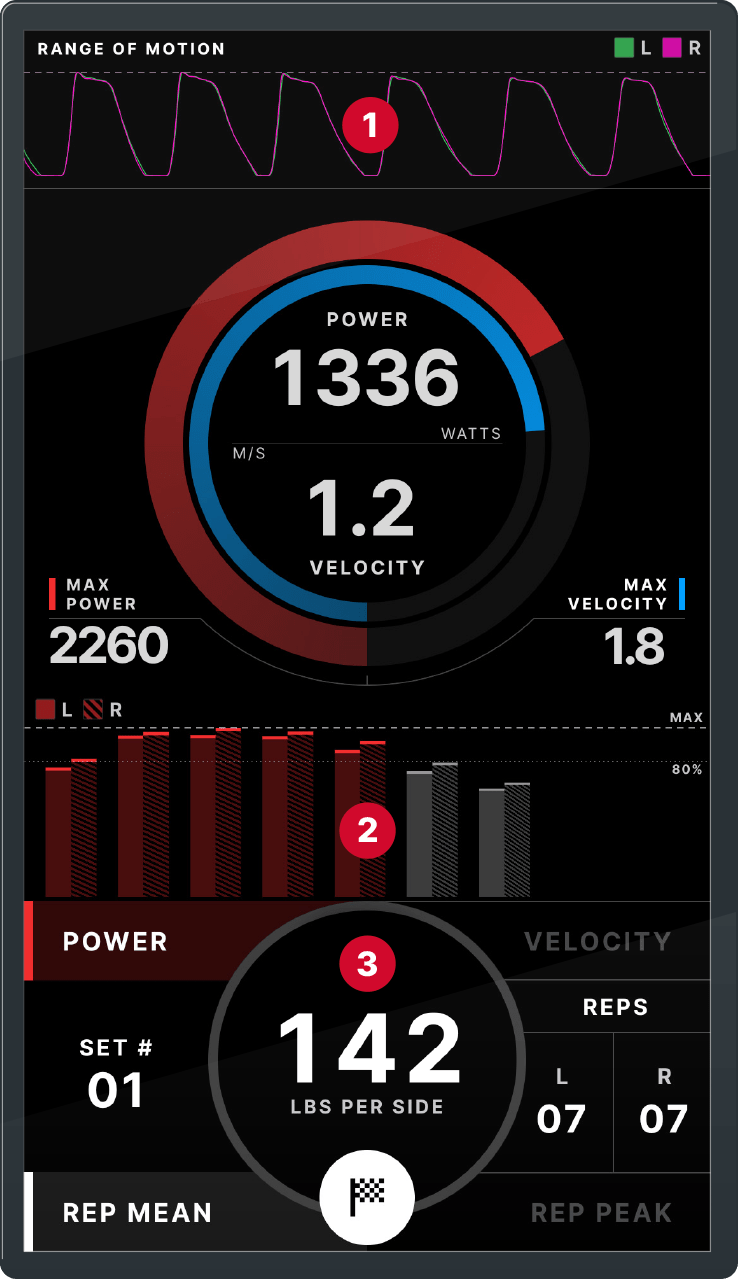
    Capture vast amounts of performance data in the weight room or clinic. A400 makes it easy to capture force, velocity, power, and range of motion to track progress.

  • Performance drop-offs show when to stop.

    Performance drop-offs show when to stop.

    Set custom performance drop-off levels (e.g. 80% of peak power). See when more reps would produce diminished returns. Know when to end a set to save time and reduce risk.

ANALYTICS INTEGRATION

EXPORT YOUR DATA FOR YOUR ANALYTICS

Quantify progress in load, velocity, and power automatically. Then, bring it into your analytics  or records system so you can track everything.

  • A400 DISPLAY

    A400 DISPLAY

    During exercise, the A400 Display captures your performance data.

  • Tablet/Mobile Device

    Tablet/Mobile Device

    Connect to the A400 system via mobile phone or tablet.

  • Raw Data Files

    Raw Data Files

    Download A400 data in CSV format from the display to your smart device.

  • Your Analytics

    Your Analytics

    Import your data files into your custom or off-the-shelf analytics platform.

SEE UNILATERAL IMBALANCES

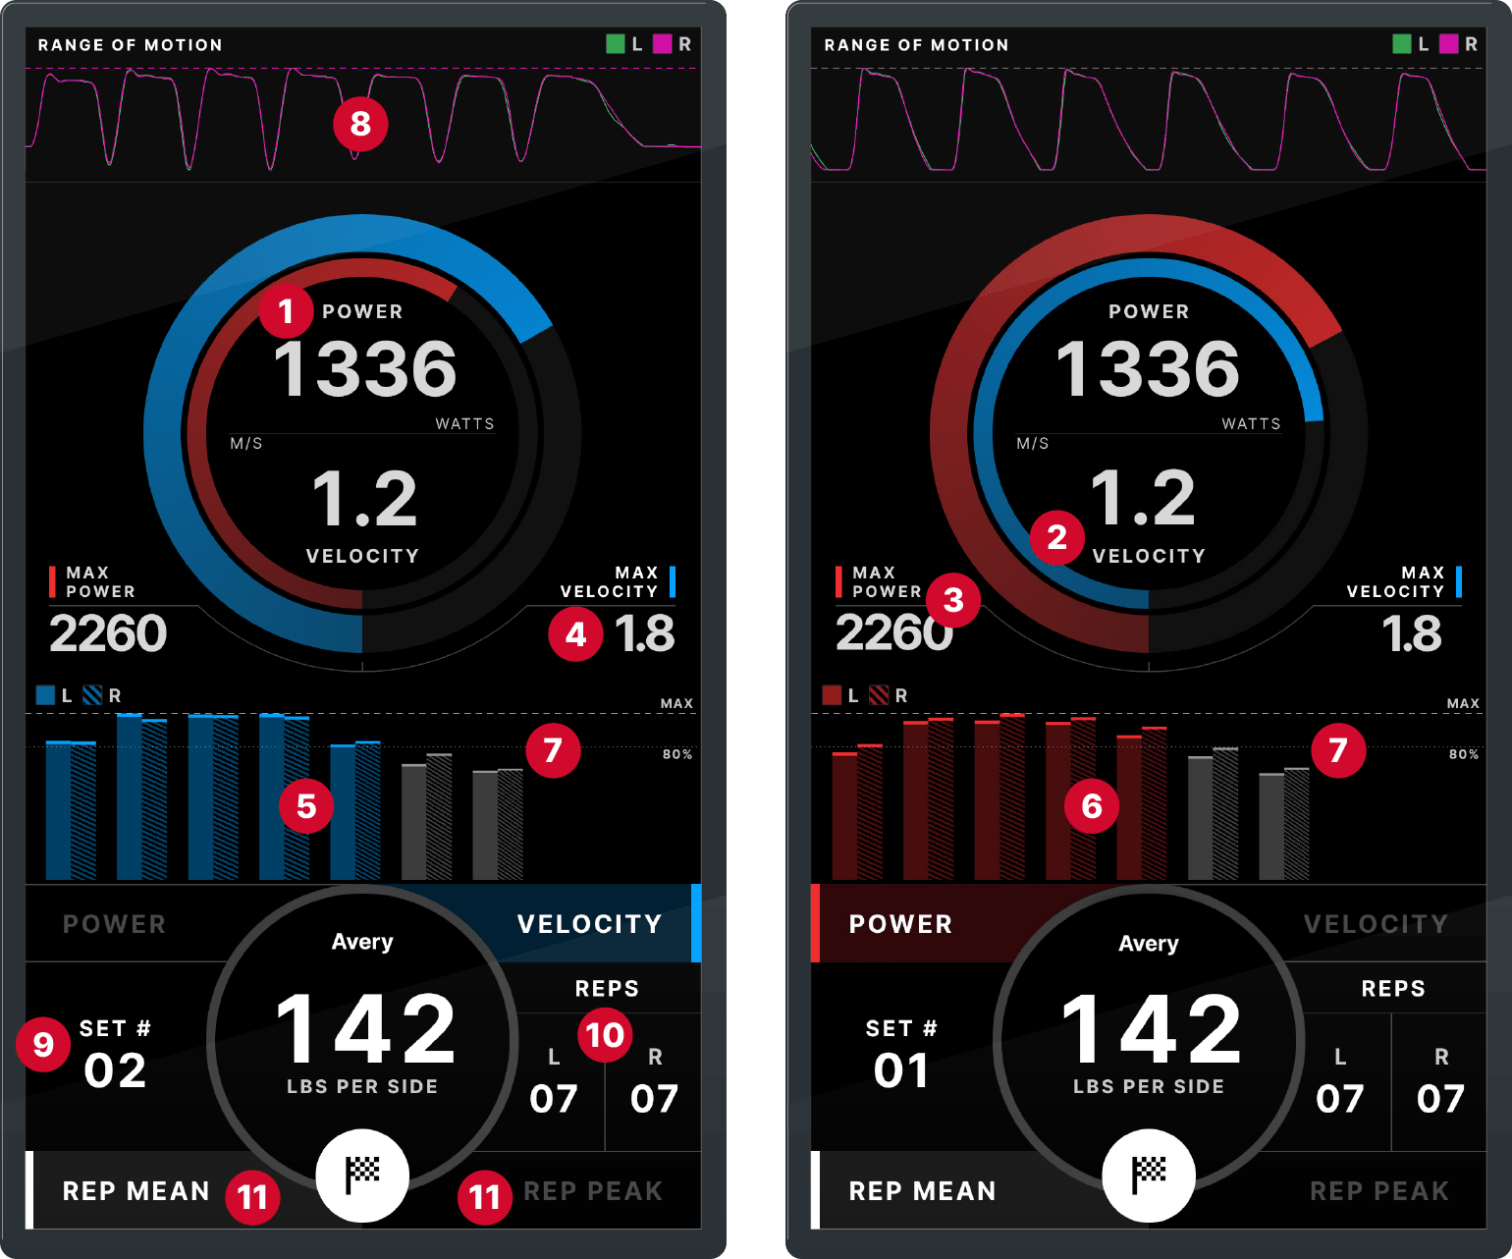
Identify imbalances between left and right limbs that can lead to underperformance and injury (on unilateral machines only). Train or rehab for symmetry.


  1. Unilateral range of motion: See a visual comparison for both left and right sides in both concentric and eccentric phases.
  2. Unilateral bar graph: See visual comparisons of power and velocity by rep for both left and right sides.
  3. Unilateral Resistance Level
15.6″ TOUCH-SCREEN DISPLAY

PERFORMANCE INSIGHTS AT YOUR FINGERTIPS

Powerful data visualisations that make it easy to see the insights in the data.

  1. Power by rep (Peak or Mean)
  2. Velocity by rep (Peak or Mean) 
  3. Best power per set (Peak or Mean)
  4. Best velocity per set (Peak or Mean) 
  5. Velocity over time See a unilateral (left and right sides) or bilateral velocity data for each rep. 
  6. Power over time See a unilateral comparison (left and right sides) of power for each rep. 
  7. Performance drop-off Identify less effective reps and monitor fatigue. 
  8. Range of motion Unilateral (left and right) range of motion for each rep. 
  9. Set counter
  10. Rep counter
  11. Mean and peak selection

SEE DEEP INSIDE SETS – AND EVEN REPS

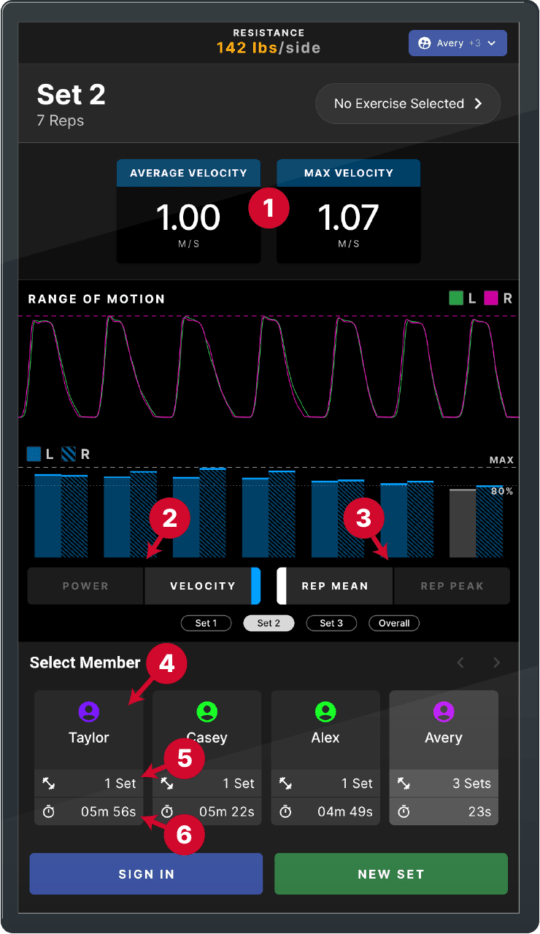
Understand the dynamics behind an athlete’s performance. Inspect each set and the reps within it.

See how an athlete’s power and velocity drive performance and motion characteristics. See the data behind performance drop-offs. Compare these factors on a unilateral basis on unilateral machines.

  1. Session and set data: Review data for a particular set or cumulative data for the session.
  2. Power/velocity selection
  3. Mean/peak selection
  4. Select a group member
  5. Set counter
  6. Time since last set

SEE OVERALL PERFORMANCE

Get the insights needed to fine-tune training to drive peak performance.

The A400 overall screen gives you an overview of an individual’s performance across all sets for an exercise.

  1. Set selection: Select “Overall” or an individual set.
  2. Resistance: Maximum and Average.
  3. Power: Maximum, Minimum, Average, and Total Volume.
  4. Velocity: Maximum, Minimum, Average, and Drop-off.
  5. Unilateral or bilateral metrics

GET THE A400 BROCHURE

Explore Keiser’s A400 technology in-depth, including advanced use cases.

DOWNLOAD BROCHURE Arrow Right

QUESTIONS? ASK A REP.

Our nationwide team had a Keiser representative near you.

  • Get pricing

    Get pricing

    Request a price quote.

  • Ask about financing options

    Ask about financing options

    Easy business leasing available. Learn about attractive options that may be available to you.

  • Try our equipment

    Try our equipment

    Your local rep can bring one of our mobile showrooms to to you.

  • Consult our experts

    Consult our experts

    Our market sector specialists understand your needs and have the answers for your questions